

Wall Street analysts are sour on US stocks. Historically, this has meant that the market has likely climbed over the coming months, with gains occasionally breaking into double-digit percentage territory.
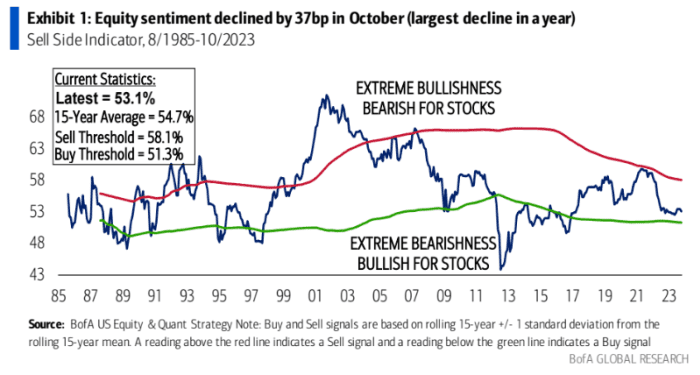
Bank of America’s sell-side indicator, a gauge of Wall Street analysts’ expectations of U.S. stock market performance, fell 37 basis points to 53.1% in October while the S&P 500 fell 2.2%, according to a Bank of America report. Savita Subramanian acquired by MarketWatch on Wednesday.
The decline represents the indicator’s first drop in sentiment since May, and the biggest drop since last October. The indicator is based on the notion that Wall Street sentiment is a reliable counter-indicator, meaning that stocks tend to climb when the gauge falls, and vice versa.
“The SSI was a reliable contrarian indicator in other words, it was a bullish signal when Wall Street was extremely bearish, and vice versa. Although the indicator is currently in ‘Neutral’ territory (less predictive range than the more extreme ‘Buy’ or ‘Sell’ thresholds) , it is much more bearish than bullish, almost 3x closer to a “Buy” signal than a “Sell”. ,’” said Subramanian.
BANK OF AMERICA
According to Subramanian, at its current level, the SSI projects a 15.5% price return over the next 12 months for the S&P 500 SPX.,
which would put the index around 4,850, which would be a new record high.