

In the long run, stock prices become a function of what they essentially represent – the value of a business. Conventional valuation parameters, based on fundamentals such as earnings, indicate that valuations have moved to a higher trajectory. This either means that Indian companies are poised to deliver superior earnings growth or are overvalued.
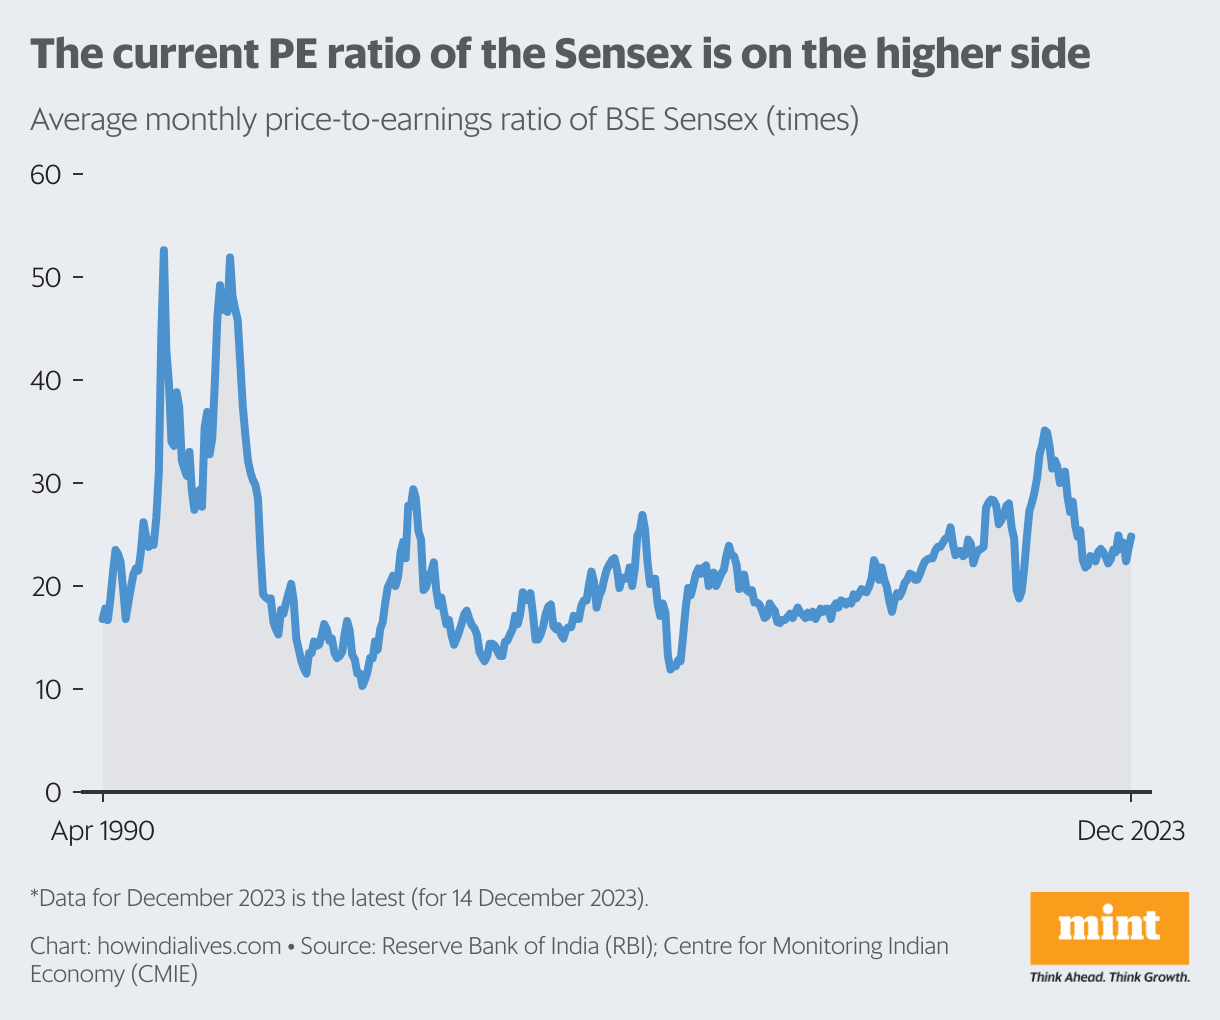
On 14 December, at its closing value of 70,514 points, the S&P BSE Sensex was valued at 24.8 times the earnings of its 30 constituents. This average monthly price-to-earnings (PE) ratio of the Sensex has been higher than this only about 20% of the time since 1990.
Although it has delivered gains even at higher valuations, some of the corrections have been brutal – the Harshad Mehta securities scam in 1992, the dot-com crash in 2000, and the US financial contagion in 2008.
Unlike those phases, this Indian market is not terrible. But it departs from both its own long-term averages and from other markets, increasing levels of downside risk.
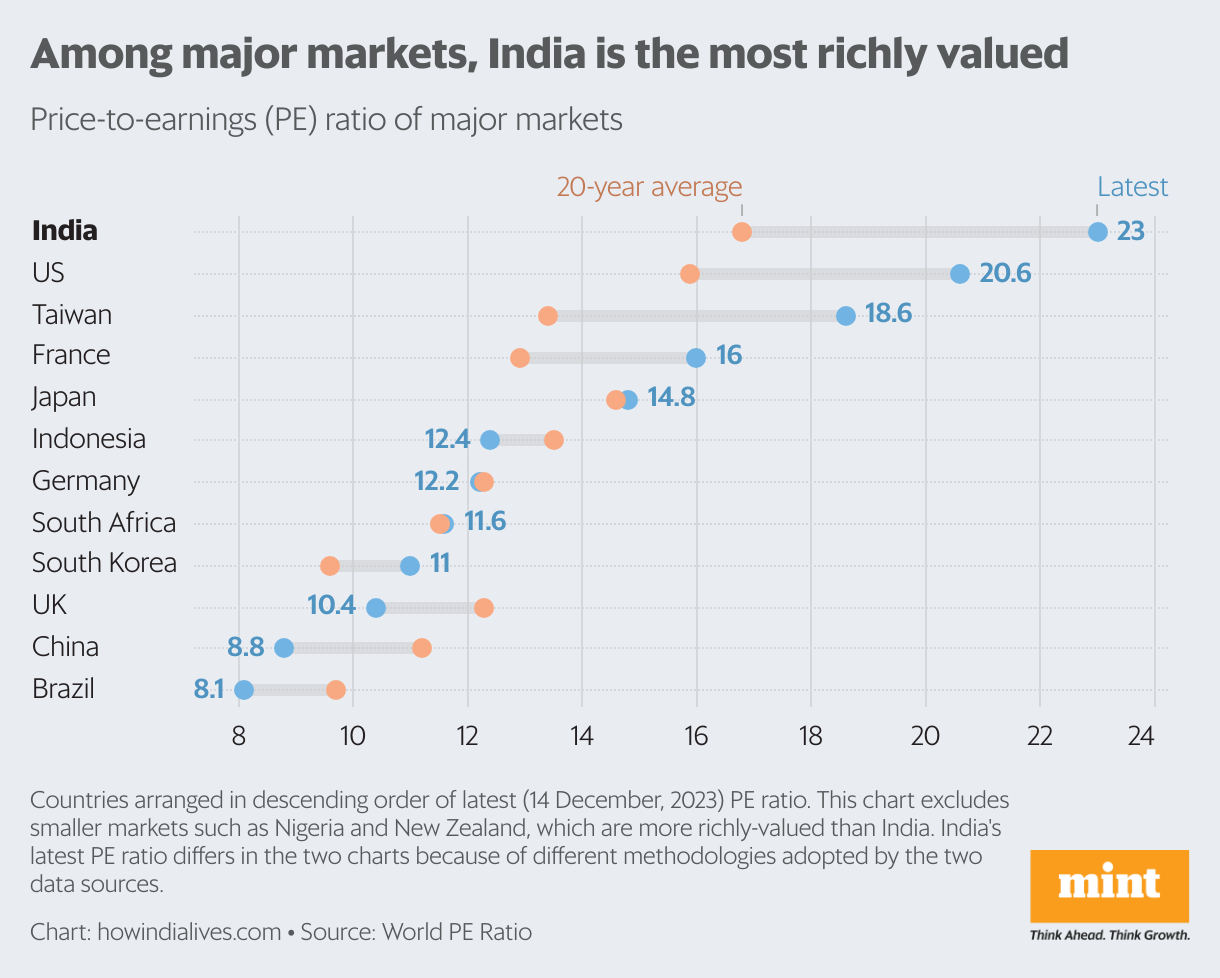
Among 45 markets tracked by World PE Ratio, a financial information website, India is the third most richly valued, after Nigeria and New Zealand, both small markets. Of these 45 markets, 16 are trading above their 20-year PE average, led by New Zealand, India, Taiwan and the United States.
Deviate from average
The 20-year PE average of the Sensex is 16.8. In other words, it is currently about 40% above its 20-year average. The PE ratio is relative, reducing with revenue growth. Theoretically, a 25% increase in earnings of the 30 Sensex companies will reduce this ratio from 24.8 to 19.8, where it starts to look more reasonable. A 15% increase in revenue will bring it down to 21.6.
The Sensex is less of a concern as it comprises the best of India Inc, and their long-term prospects remain good. Of more concern are indexes that represent the lower reaches of the stock market.
Some have achieved significantly more than the Sensex in 2023, and their constituents are lesser known, some might even be flavors of the season. The S&P BSE IPO index, for example, is up 43% and trades at a PE of 47. Can companies in that set grow their earnings 50-100%?

All about earnings
Revenues in the past three years have been affected by the Covid-19 pandemic. So, in some quarterly periods, there is a base effect to calculate. From the fourth to September 2022, the covid effect is contained.
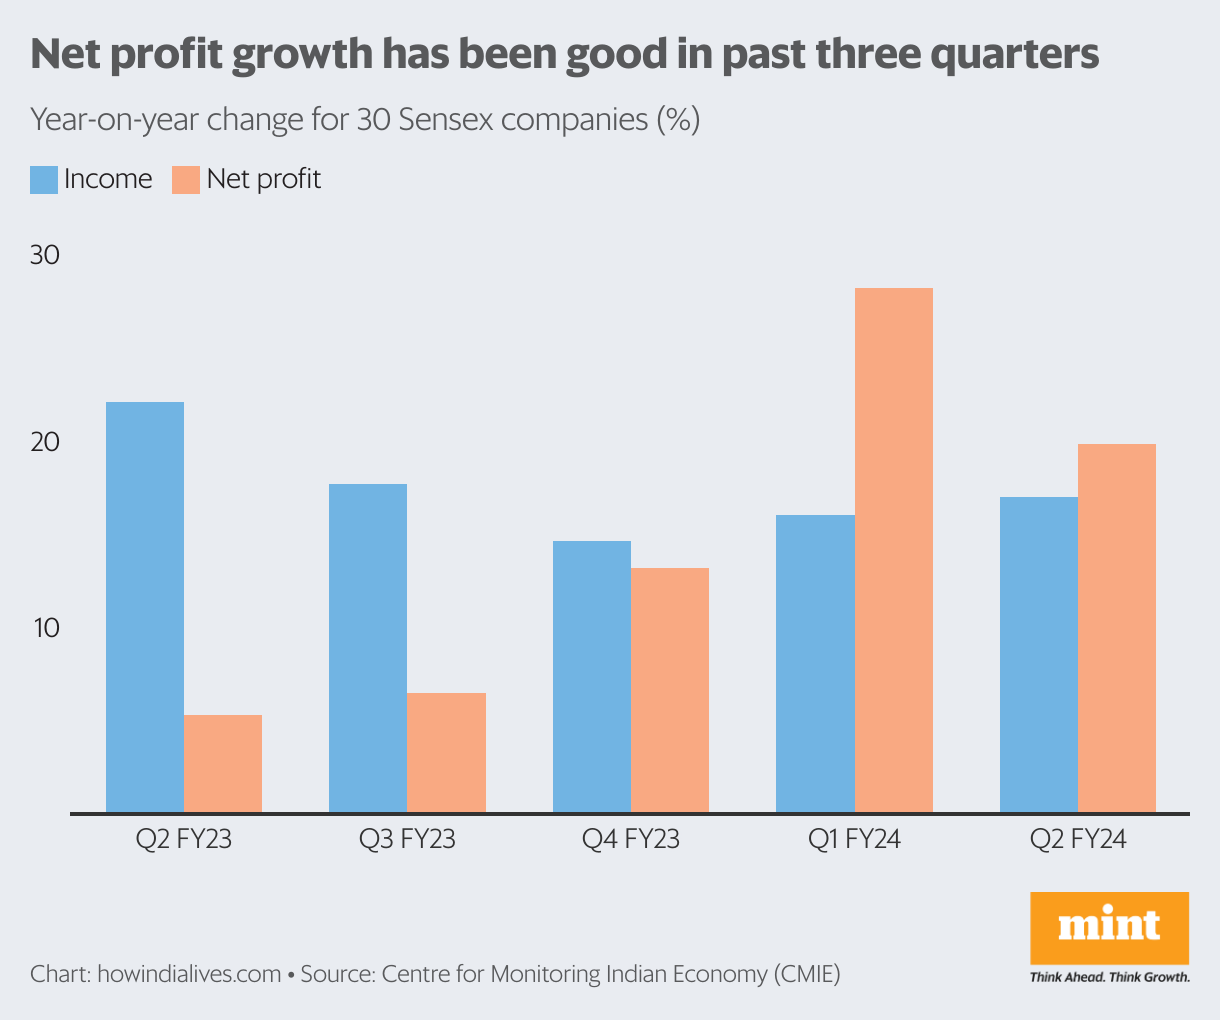
In the five quarters beginning September 2022, year-on-year growth in combined net profit for the 30 Sensex companies ranged from 5% to 28%. Revenue growth over the year was much more stable, ranging from 15% to 22%.
When the market assigns a PE of 24.8 to Sensex, the best case scenario is an expectation that corporate earnings will grow rapidly – 25-30% per annum. If that doesn’t materialize, corrections could follow.
Corrections can be particularly painful if any acceptance of overstated fundamentals coincides with weakening investor sentiment and drying up of money taps, which are currently filled with eager foreign and retail funds looking to ride the momentum.
Rich market
Another metric used to evaluate markets for wealth of valuations is the market capitalization-to-GDP ratio. Roughly speaking, this is the price-to-sales ratio for an entire country. Over the years, the reading of this ratio has been that a figure below 50% makes a market undervalued and a figure above 100% makes it overvalued.
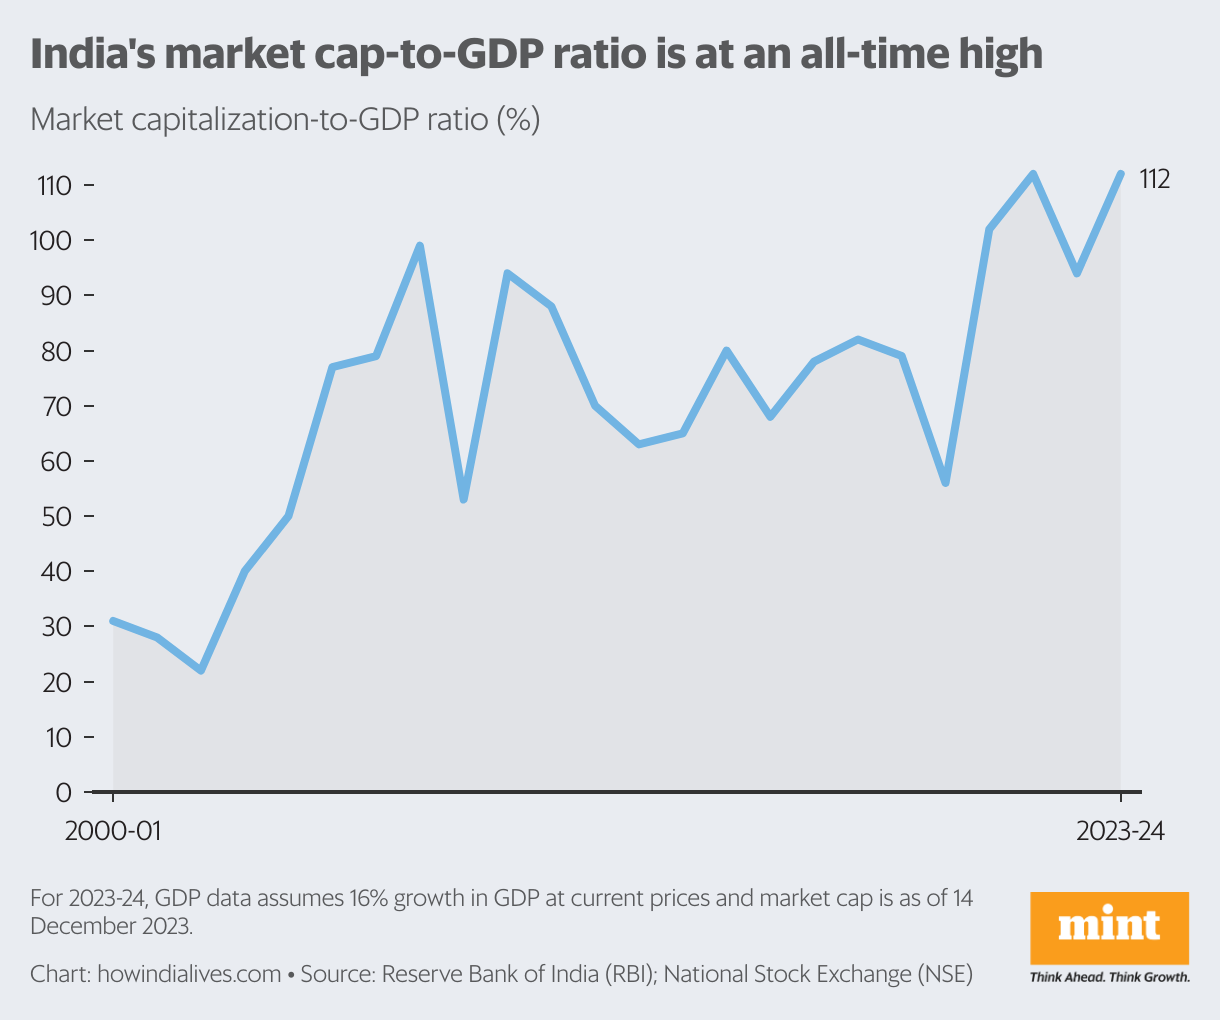
On an average annual basis, the Indian market, as represented by all stocks in the National Stock Exchange, crossed a market cap-to-GDP ratio of 100% for the first time in 2020-21. It is now 111% on estimated 2023-24 GDP, an all-time high.
One reason is the multitude of new listings, leading to an inorganic expansion of the market cap. However, this is cautious territory. At these assessments, greater demands will be placed on revenue growth, both by how much and how soon. Disappointments on both fronts could hurt.
www.howindialives.com is a database and search engine for public data